- All
- Company News
- Events
- Industry news
- Press room
Discover Reuniwatt’s Cutting-Edge Cloud Observation Technologies at Airspace World 2025

...
[Webinar Series] Asset Optimisation for Offgrid Projects using advanced performance analytics

...
PV plants + storage with forecasting: solutions for energy transition the French overseas territories

...
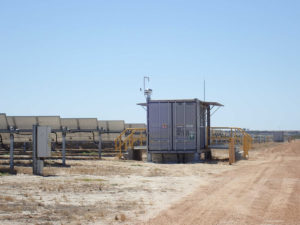
Off-Grid Solar: Practical advice for the implementation of weather forecasts with sky cameras
...
[Webinar Series] Expert Knowledge for Mega Solar Projects

Date Language Webinar Title Webinar on Demand French Centrales PV+stockage avec prévision : solutio...
R&D: Artificial intelligence for data assimilation and sky cameras

Clouds, precipitation and wind have a significant and direct impact on all levels of traffic. Reuniw...
Climate Change: Perspectives for the European PV Sector
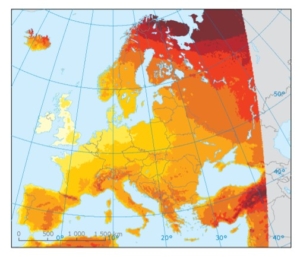
In his Climate Speech on 23 Jan 2020, UN Climate Change Deputy Executive Secretary Ovais Sarmad call...
Renewables in France: Reunion Island is taking a lead

On 17 August 2015, the french government adopted the energy transition act for green growth. Almost ...
Italy’s growing solar capacity now backed by weather forecasts

Following a tender for solar energy forecasting services in 2019, Reuniwatt has been one of the sele...
Solar and wind forecasts in Morocco

After 8 successful editions, the Solaire Expo Maroc event has become the leading trade fair for rene...
Reunion Island on the road to energy self-sufficiency by 2030

Reunion Island is facing the challenge of saying goodbye to imported fossil fuels and reaching energ...
New Years Wishes

Thank you for your trust over the last decade. We wish all our customers, followers, supporters and ...
Solar Asset Management with SunSat™ Digital Twin
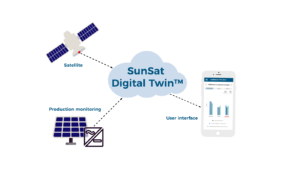
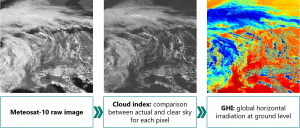
Reuniwatt’s SunSat™ Digital Twin offers PV performance monitoring through satellite-to-irrad...
The importance of innovation at Reuniwatt

Innovation is the cornerstone of Reuniwatt’s strategy, which is why we engage on many R&D ...
An Interview with Founder and CEO Nicolas Schmutz

Reuniwatt is a leading expert in atmospheric science and solar forecasting with a strong focus on R&...
Meteorological Technology World Expo 2019

Come and meet us at the next Meteorological Technology World Expo, the world’s largest meteoro...
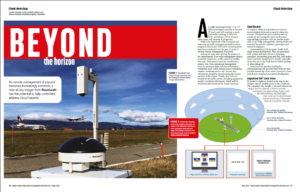
Cloud-reporting with Sky InSight™ featured in Meteo Tech Intl.

Meteorological Technology International Magazine has published an article about all-sky imagers show...
Forecasting Pioneers in Reunion Island

Policy-makers around the world recognize the value that investing in R&D can give back to societ...
Masen chooses Reuniwatt for its solar forecasts

The Moroccan Agency for Sustainable Energy selected Reuniwatt following a tender process for solar f...
Middle East Electricity 2019

We are thrilled to announce our participation to the next edition of Middle East Electricity, the le...
How Renewables change the face of a tropical island

Thanks to the government’s strategy and financial incentives, the energy market on Reunion Island ...
Meteorological Technology World Expo 2018

Come and meet us at the next Meteorological Technology World Expo, the world’s largest meteoro...
Intersolar Europe 2018: shaping the new energy world

Reuniwatt will be at Intersolar Europe, the world’s leading exhibition for the solar industry,...
Reuniwatt’s sky imager highlighted in Meteo Tech Intl. Magazine

Sky InSight™ is showcased in the April 2018 issue of Meteorological Technology International M...
Reuniwatt to strengthen its meteorological offer

Reuniwatt, a French company specialised in cloud observation and forecasting, announced the arrival ...
Voltalia partners with Reuniwatt in its first solar plant in Brazil

Reuniwatt’s ground sky imager will collect images that will help Voltalia get the best perform...
E-world 2018: See what you cannot see

Reuniwatt will be present at E-world energy and water, Europe’s leading energy trade fair, for...
SunSat™ time series, historical data compatible with PVsyst
...
DEIF’s controller systems and Reuniwatt’s ground imagers are compatible to optimise PV consumption on hybrid projects

...
Reuniwatt extends Country Forecast to UK
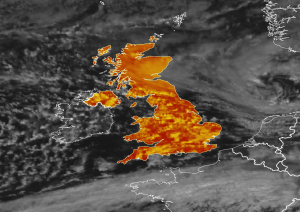
While UK has been the leading european solar market for 3 years in a row and reached the 12 GW mark ...
meteocontrol and Reuniwatt form a partnership for satellite estimations and forecasts in Asia
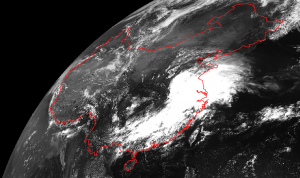
French solar forecasting pioneer Reuniwatt and German leading provider of technical consulting and m...
Towards a single energy market in Europe

In the frame of the integration of national energy markets, European institutions show a willingness...
Reuniwatt will be present at E-World Energy and Water 2017

From the 7th to the 9th of February 2017, will be held the E-World Energy and Water tradeshow in Ess...
Eumetsat 2016: Solar forecasting presentation at the Meteorological Satellite Conference

...
Case study: Lack of flexibility in European electrical systems leads to deteriorated grid management

How solar forecasting could avoid negative energy prices due to high renewable energy generation. Th...
Reuniwatt’s innovative ground imager supplies forecasts to IssyGrid®

IssyGrid®, first operational smart grid district in France The IssyGrid demonstration project is op...
Solar forecasts for energy trading

Solar forecasts for energy trading have become vital, in particular with the arrival of direct marke...
Solar forecasting: take control of your system, in EES Intl. Magazine

Reuniwatt’s forecasting solutions for solar+storage systems are presented in the 5th issue of ...
Reuniwatt, member of the International Energy Agency’s Task 46
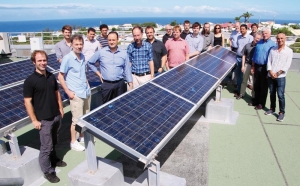
In order to get the best out of solar energy, a good knowledge of the resource is essential. An accu...
Reuniwatt to provide short term forecasts for the IssyGrid® demonstration project alongside Total

Expert in Photovoltaic (PV) energy production forecasting, Reuniwatt signed up a partnership with To...
Musk unveils Tesla’s Powerwall: En route to a new energy era?

Last April in Hawthorne (California), founder of Tesla Motors Elon Musk, the current leader in the e...
Solar impulse: the solar airplane

If you live in Abu Dhabi, Muscat or Ahmedabad, you might have seen a weird bird flying above you. Wi...
Cloud computing: the disruptive technology for the three years to come

According to a KPMG report entitled “The changing landscape of disruptive technologies” publishe...
Solar forecasting & solar system performance modeling services by Reuniwatt – An article by Solar Choice
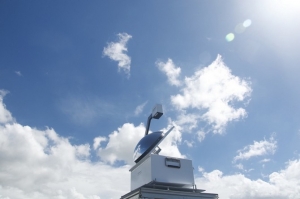
Solar Choice is a brokerage for residential solar systems and a tender manager for commercial proje...


